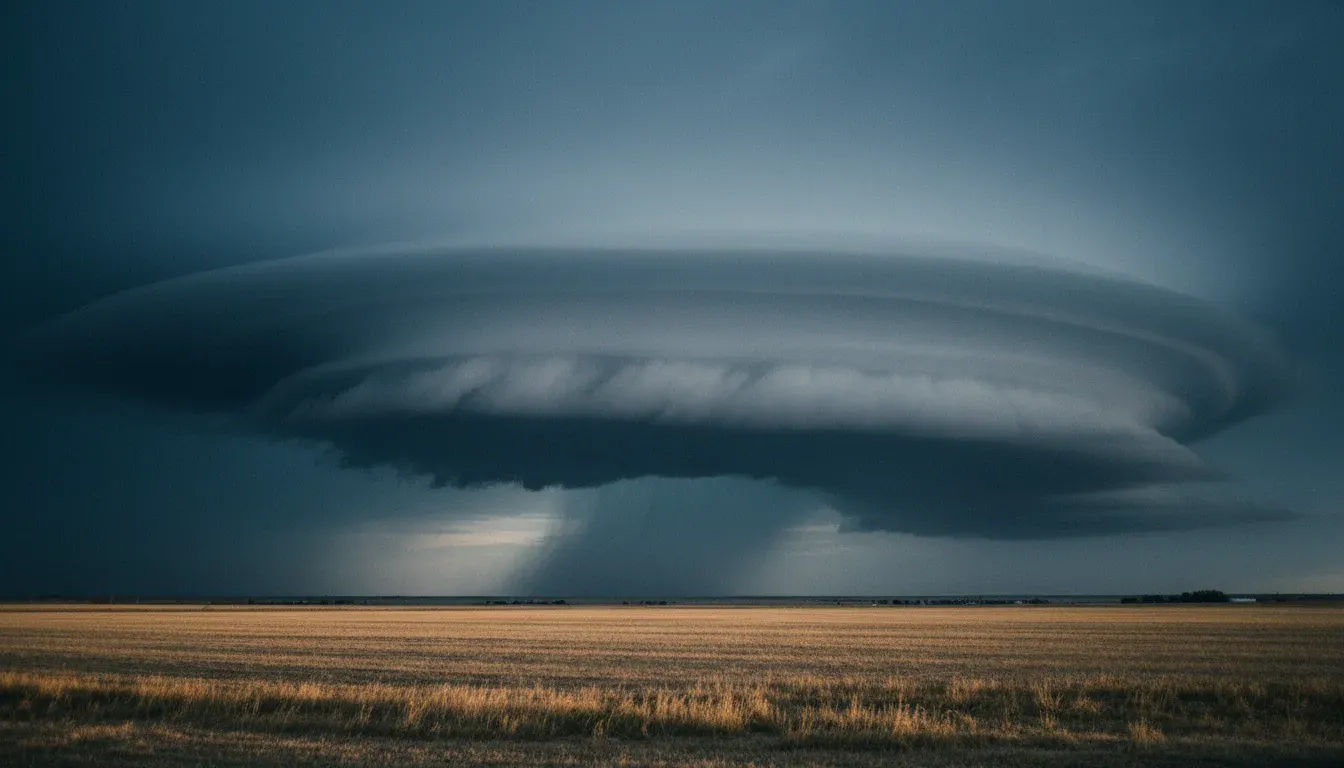
Meet Anvil — the hail intelligence platform behind every alert Hail Sentinel sends. Today it gets a name, a version number and a public report card: Gen 1, the first complete generation. Four named models, running in production, measured in the open against the baselines the rest of the industry runs on.
Anvil exists to answer one question for anyone with a roof, a fleet or a forecast desk: is the storm overhead putting hail on the ground, here, right now — and did the system know while it was happening? Gen 1 is the first release where that answer is measured at the grain people actually live at — a storm, over a place, during an hour — and published beside the numbers that produced it.
Every figure on this page comes from one measurement campaign: one window, one cohort, one definition of truth, and every system scored on the same storms.
The scoreboard
Hold every system to the same alarm budget. Score them on the same storms, against the same ground truth — hail that people stood under and wrote down. Then count. Against the two operational baselines the industry runs on, the radar hail estimate (MESH) and the probabilistic storm model (ProbSevere v3), Anvil leads every head-to-head we ran:
| Contest Higher is better | Anvil | ProbSevere v3 | MESH |
|---|---|---|---|
| Threat score (critical success index) Track grain · corroborated truth · 4,430 hail-producing tracks | Best of the systems compared on this metric: 0.1268 | 0.0947 | 0.0829 |
| Catch rate, held to MESH’s own alarm budget Track grain · corroborated truth · all storm tracks | Best of the systems compared on this metric: 77.8% | no value in this arm | 56.7% |
| Catch rate, held to ProbSevere v3’s own alarm budget Track grain · corroborated truth · tracks ProbSevere v3 scores | Best of the systems compared on this metric: 83.8% | 75.3% | no value in this arm |
| Ranking power (area under the ROC curve) Threshold-free · 3.83M scans all three systems scored · corroborated truth | Best of the systems compared on this metric: 0.9885 | 0.9814 | 0.9590 |
| Precision-recall area (AUC-PR) Same cohort · a random classifier scores 0.0027 | Best of the systems compared on this metric: 0.2886 | 0.2089 | 0.1445 |
| Storm days with the higher score, against ProbSevere v3 83 storm days · day-level precision-recall · corroborated truth | Best of the systems compared on this metric: 66 of 83 | 17 of 83 | no value in this arm |
| Storm days with the higher score, against MESH 83 storm days · day-level precision-recall · corroborated truth | Best of the systems compared on this metric: 78 of 83 | no value in this arm | 5 of 83 |
Every row points the same way. The threat score is the balanced measure — no system can lift it by crying wolf. The catch rates are taken at the rival’s own budget, so the remaining gap is skill, not appetite. The ranking scores need no threshold at all. And the season, taken one storm day at a time, lands on Anvil on 78 of 83 days against the radar estimate and 66 of 83 against the storm model.
Four models, one platform
Every Anvil model carries its job and its generation in its name: anvil-JOB-VERSION. The middle word says what the model is for, never how it is built, and the version is a promise — a generation you can cite, hold us to, and watch improve. Two of the four are trained machine-learning models; two are calibrated statistical models, and every card prints its class line so the method is never left to inference.
The detection model
Trained machine-learning model.The address-level nowcast
Trained machine-learning model.The same-day layer
Calibration layer. Not a trained machine-learning model.The multi-day outlook
Calibrated statistical model. Not a trained machine-learning model.For your home
Did it know while the hail was falling — and did it stay quiet when it should?
Most detection figures in this industry count radar objects. Nobody has ever stood under a radar object. A storm is what people experience, so a storm is the grain Gen 1’s headline is published at: ground reports clustered into the storm that produced them, and a storm counted as confirmed only when anvil-detect-6 cleared its shipped bar inside the window the hail was actually falling in.
93.6% of the storms in the published cohort — 528 of 564 — were confirmed while the hail was falling, measured over storms that at least 2 independent observers on the ground reported. Corroboration is the strictest truth we have: every storm in this cohort is one somebody stood under and wrote down.
The other half of the promise is silence. A hail system that never misses and never shuts up is worth nothing, so Gen 1 is measured on the quiet days too — days and regimes where the absence of hail is established, not assumed:
Then there is the week ahead. anvil-outlook-1 carries the picture out to day 7 for every location, and it is the one member of Gen 1 that has earned the word skill: measured against climatology, it holds a positive Brier skill score at every day it serves. At the day- 2 lead it flags 78.6% of hail days while alarming on 0.80% of quiet cell-days.
And the day itself gets its own model. anvil-today-3 re-levels the morning number against what the day actually does: over its re-certification set, expected calibration error fell by 46% — from 0.0083 to 0.0045 — across 1.73M out-of-sample cell-days. What it improves is calibration: the day’s stated probabilities move measurably closer to the rate they verify at.
For your business
Every storm scored. Every alarm earned. Served to your console and your API.
A fleet, a yard, a book of insured roofs: a business does not experience one storm at a time, it experiences the whole season. Two things decide whether a hail feed is worth wiring into an operation — how much of the sky it actually scores, and how much of what it says is worth acting on.
You cannot catch a storm you never scored. Anvil is built to have an opinion on every storm object on radar — and on the tracks the probabilistic baseline never scored at all, it caught 1,782 hail-producing storms outright.
Then hold it to a budget. The objection to any catch rate is that a system can buy it by alarming more, so take the alarm burden each baseline itself spent, cut Anvil to exactly that burden, and count again:
Same alarms, more hail. At MESH’s own burden Anvil catches 21 more points of hail-producing storm tracks; at ProbSevere v3’s own burden, on the tracks it scores, 8.5 more. For an operation that rolls trucks, adjusts claims or moves a fleet under cover, that is the difference between an alert feed and a noise feed.
Once a storm is on radar, anvil-nowcast-2 carries its hail probability onto a single point — a yard, a lot, a monitored address — over each horizon ahead. The baseline it had to beat is the leg it replaced: Lagrangian persistence — each currently-observed storm keeps its present hail probability and advects along its own measured motion vector. Cut both arms at the threshold that reaches the same number of confirmed catches, then count the alarms each raised to get there:
All of it is served. Detections and address-level nowcasts arrive in the console and through the business API, and the same models run behind every monitored area a team sets up. Business access is by invitation while pricing is finalised — request an invite.
For meteorologists
Measured the way the field measures — corroborated truth, matched burden, day-clustered intervals.
At track grain — one radar object’s life — the balanced measure is the critical success index, the threat score: misses and false alarms charged to the same account, so no system can lift it by alarming more often. Measured on corroborated truth across 1,800,879 storm tracks and 4,430 truth tracks, Anvil leads both baselines by a wide margin:
A pooled number can hide a season. So take the campaign one storm day at a time, and ask on each day which system held the higher precision-recall score:
Threshold-free, the picture is the same. On the matched cohort — the 3.83M scans where all three systems produced a value — Anvil holds the largest area under both the ROC and the precision-recall curve, and against a base rate of 0.27% its precision-recall area is 106 times a random classifier’s, against 77 for ProbSevere v3 and 53 for MESH. And where the two probabilistic systems can be compared on the reliability of what they say, on one common cohort at one base rate:
The outlook is graded the same way, with its intervals printed:
| Lead | Area under the ROC curve | Brier skill vs climatology | Hail days flagged | Quiet cell-days alarmed |
|---|---|---|---|---|
| Day 2 | 0.919 (0.903–0.933) | +0.0831 (0.0641–0.1021) | 78.6% | 0.80% |
| Day 3 | 0.897 (0.876–0.915) | +0.0530 (0.0355–0.0704) | 74.6% | 0.32% |
| Day 4 | 0.876 (0.852–0.897) | +0.0390 (0.0240–0.0543) | 55.0% | 0.28% |
| Day 5 | 0.855 (0.830–0.878) | +0.0274 (0.0156–0.0395) | 44.6% | 0.17% |
| Day 6 | 0.847 (0.822–0.869) | +0.0219 (0.0133–0.0306) | 41.7% | 0.10% |
| Day 7 | 0.830 (0.805–0.853) | +0.0157 (0.0081–0.0235) | 33.5% | 0.04% |
Every interval on this page is day-clustered. Storm scans cluster by day; a pooled interval over millions of scans reports a confidence nobody has.
Measured in the open
Gen 1 is a starting line, not a trophy. The version numbers exist so the next generation has something to beat: when a name on this page changes, it will be because the figures above moved, and the artifact behind them will say by how much. Every number here is read from one versioned campaign file at build time — none is typed into the page — so a claim and its evidence cannot drift apart without the build failing.
That standard is rarer than it should be. Before publishing this page we surveyed the commercial field for anyone else grading their own homework:
We would rather publish a number you can check than an adjective you cannot.
How these numbers were measured
- The storm cohort. 93.6% is confirmation over 564 storms carrying at least 2 independent ground reports — the strictest truth we have, and the cohort travels with the figure wherever it is quoted. Every storm in the cohort counts, including those radar never resolved into a trackable object.
- Corroborated truth. Every head-to-head on this page is scored in that scope: a truth row is kept only when its ground truth attributes to a storm at least 2 people reported, applied identically to all three systems by a rule that reads no system’s score.
- Matched alarm budget. Each catch-rate contest cuts Anvil to the alarm burden the baseline itself spent — its own tracks on alarm — before counting. The ProbSevere v3 arm is measured over the tracks it scores, because it produces no value on the rest; MESH covers the full cohort, so its arm uses it. At storm grain the comparison figures are Anvil’s own record; the head-to-heads are at track grain, where the budget-matched measurement exists.
- The nowcast ratio is pooled over 20 storm days; the day-clustered interval clears 1.0, and the separation from persistence is measured at the 30- and 60-minute horizons.
- Two of the four are statistical. anvil-today-3 — Calibration layer. Not a trained machine-learning model. anvil-outlook-1 — Calibrated statistical model. Not a trained machine-learning model. A figure from either is not evidence about a trained model. What the same-day layer improves is calibration.
- Horizons are scored distances. Every horizon and every lead day here is a distance ahead a model is graded at, after the fact. None of it is a statement about what reaches a person, or when, and we publish no figure that describes one.
- Generations. The detection head-to-heads, the coverage figures and the storm cohort are measured on anvil-detect-6, the serving generation. The reliability comparison is measured on the earlier detect generation and is labelled so where it renders; the null-day audit comes from its own artifact and window, named in its caption.
- Offline measurement. The detection and comparison figures are an offline re-scoring of the models across historical rows — the right way to obtain a sample this size. Scope: Contiguous United States only.
- Named baselines. MESH and ProbSevere v3 belong to their respective operators and are named here as the operational baselines Anvil is measured against, on the comparison basis each figure states. No endorsement by their operators is implied.