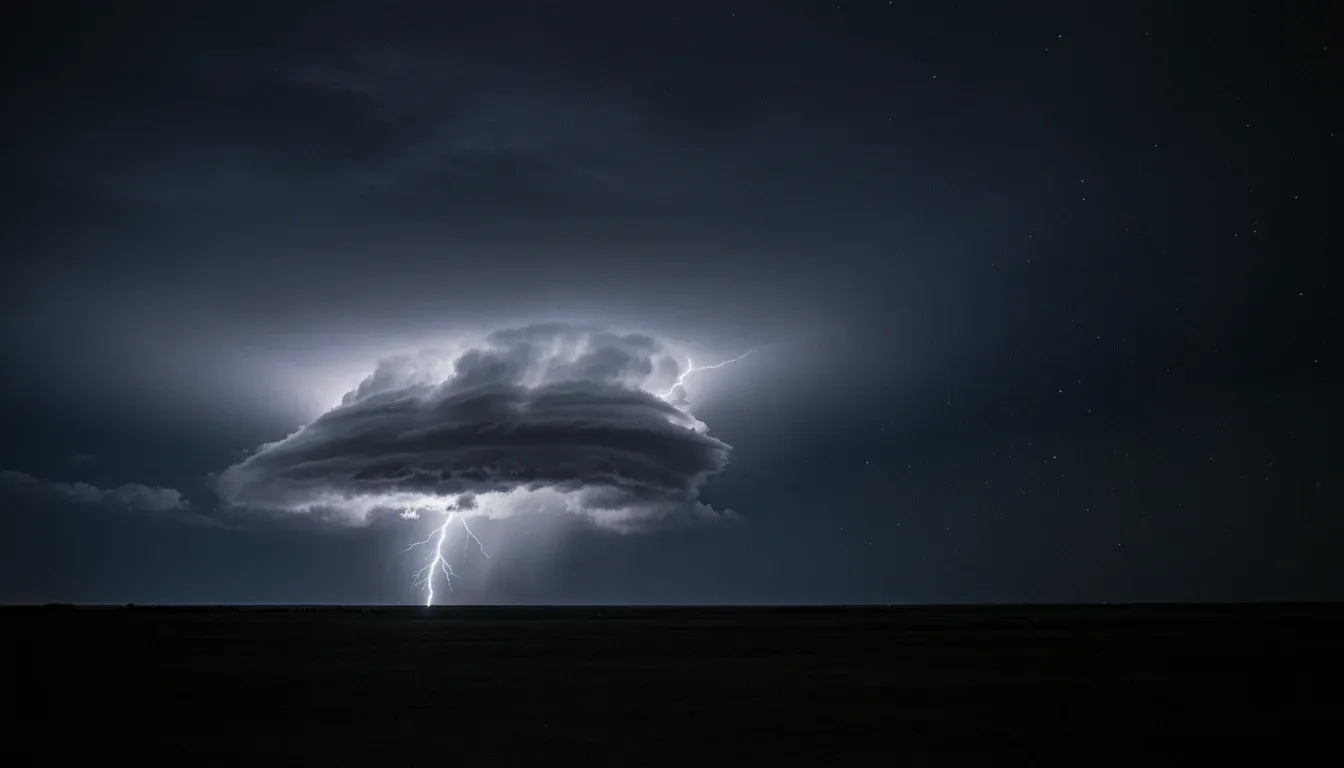
On the afternoon of 2026-08-22, a storm crossed the western suburbs of Cleveland and dropped hail up to 1.75 inches across three of them. It was not a famous storm. It made no national news. It is interesting for a narrower reason: of the three systems watching it, one had its highest reading of the afternoon while the hail was being reported, and the other two never crossed their own thresholds at all.
This is the whole record of that storm — every scan, every reading, every report — and what it does and does not tell you.
The afternoon
The replay

Below is the storm as the production pipeline saw it: per-pixel radar output, coloured by the shader the app itself draws with, driven by the probabilities that were stored while it was happening. Nothing was redrawn for this article.
Three systems, one storm
Anvil's probability on this storm started near nothing, climbed through the bar at which a storm is carried as a detection at 21:34Z, and peaked at 34.9% — above the probability bar the warning tier requires, on 3 scans.
Neither baseline reached its own operating threshold at any point in the storm's life:
The sharpest way to read it is to freeze one moment. At 21:48Z — the scan alongside which the Garfield Heights report was filed — the three systems read like this:
- Anvil — 34.9%. Its highest reading of the afternoon.
- ProbSevere v3 — no value. No object of its own was associated with this storm on that scan.
- MESH — 8.4 mm. Around a third of the severe threshold.
We also re-checked the baseline the generous way, in case the storm had simply been credited to a neighbouring object: across the storm's whole life, the highest ProbSevere v3 value on any object within 15 km was 27% — still short of its 30% bar.
What fell
Three deduplicated ground reports matched this storm, each one appearing in two independent report feeds and counted once:
- 21:19Z 1.00″ North Olmsted
- 21:22Z 1.75″ Westlake
- 21:48Z 1.00″ Garfield Heights
Sizes are the reporter's own estimate at the time. The largest, 1.75 inches in Westlake, is hail big enough to break glass and dent a car roof.
Why the baselines missed it
Look again at the replay and you can see the answer: the storm never looks like much. It stays pale, because the colour is driven by what the radar could see of the ice inside it — and by that measure, this storm was unremarkable all afternoon.
That is the mechanism. An instrument that estimates hail size keys on the radar signature of big ice aloft, and this storm did not produce a strong one; it topped out around 13.1 mm against a 25.4 mm bar. A storm that quietly puts damaging hail on the ground without the signature to match is exactly the storm such an instrument is built to miss — not through a bug, but through what it measures.
Anvil's detection model is not reading a size signature. It scores the whole storm object — structure, evolution, environment — for one question: is this storm putting hail on the ground right now. On this afternoon those two ways of looking disagreed, and the ground reports settled it.
One storm proves nothing
And it is worth saying flatly: this is one storm. Pick any system and any afternoon and you can find a storm that flatters it. A single case cannot establish a catch rate, a false-alarm rate, or that one system is generally better than another — and nothing on this page is offered as evidence that it does.
What makes this storm worth publishing is that it is a legible instance of something we have measured, at scale, elsewhere. Over the anvil-detect-5 campaign — a different generation, a different window, 2026-05-01..2026-07-30 (91 consecutive storm days, 6.88M object-scans, 26,186 report-matched) — 890 hail-producing storm tracks carried an Anvil score where the coverage-gated baseline produced no value at all , and 98.1% of the campaign's hail-producing tracks were in Anvil's view. The full comparison — catch rates at matched alarm burden, threat scores on corroborated truth, and the qualifications each one carries — is in the Gen 1 release post.
This afternoon over Cleveland is one row in that record, told slowly enough to see.
Notes and scope
- n = 1. A SINGLE TRACK, not a measurement. n=1. It is an illustration of one storm's record and is NOT evidence of accuracy, a catch rate, or a general comparison.
- No alert is claimed. The probability bar the warning tier requires. Crossing it is NECESSARY, NOT SUFFICIENT: the shipped tier additionally requires physical conditions (size, distance). Nothing here asserts an alert was sent.
- The marks are a record, not an interval. Times render in order so the storm can be followed. Nothing on this page differences two of them, and nothing describes what reached any person, or when.
- Outside the campaign. This storm post-dates the published benchmark window entirely, so it is part of no published rate. It was scored by the generation serving at the time; the campaign figures quoted above were measured on anvil-detect-5 and are labelled as such. The two are never combined.
- Named baselines. MESH and ProbSevere v3 belong to their respective operators and are named here as the operational baselines Anvil is measured against. No endorsement by their operators is implied.
- Ground truth. Cross-source-deduplicated ground reports from public storm-report networks; each appeared in two independent report feeds and is counted once. Sizes are the reporter's own estimate at the time.
- Nothing was re-scored. Production scores as stored at the time of the storm; nothing was re-scored for this article. Scope: Contiguous United States only.